$333 Median: Price Per Square Foot, Austin Neighborhood Benchmarks 2026
Austin's median: $333/sq ft. Use Realtor, FRED, and local comps to turn that number into neighborhood benchmarks buyers and builders trust.
$333 Median: Price Per Square Foot, Austin Neighborhood Benchmarks 2026
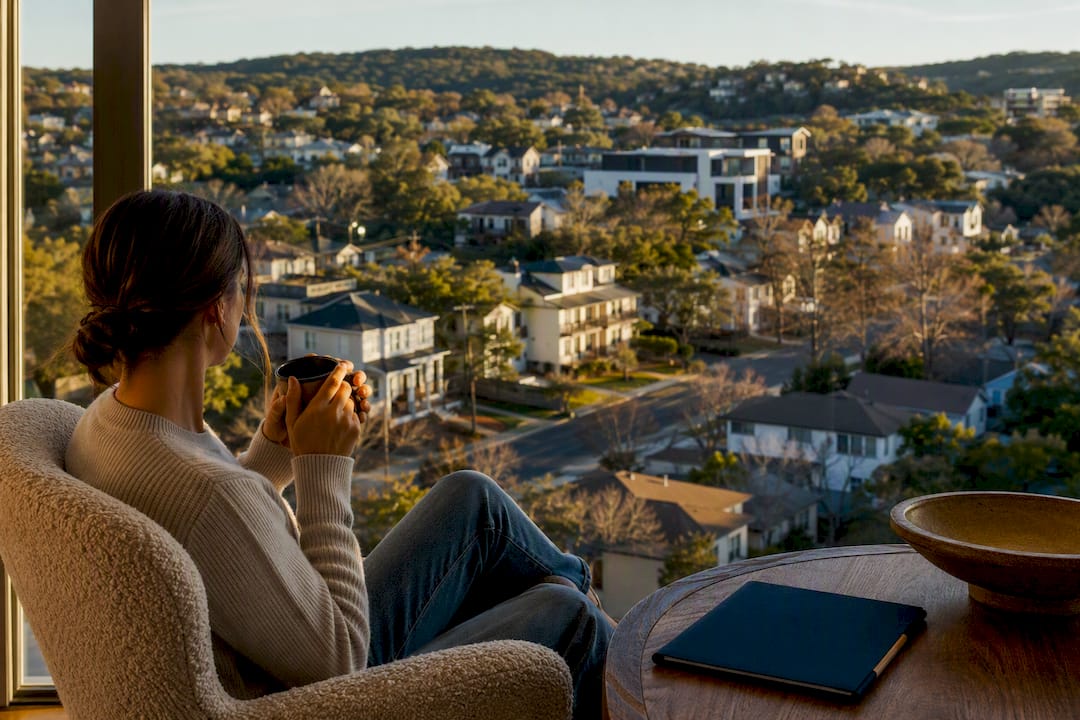
Austin’s median listing price per square foot sits around $333, according to Realtor data for Travis County. That citywide figure hides sharp swings by neighborhood, and it means something different depending on whether you’re pricing a resale home or budgeting a new build. Before you use it for any real decision, check local closed-sales comps, not just the city average.
TL;DR:
- The median sold price per square foot in Austin remains around $310 to $333, but local comps should always be used instead of citywide averages.
- Price fluctuations since 2019 show a peak in 2022 driven by pandemic migration, followed by a cooling period that is still ongoing toward 2026.
- Neighborhood-based PPSF varies widely, with central locations commanding much higher prices than outlying suburbs or rural areas, requiring localized data for accurate valuation.
- New construction costs typically range from the low hundreds to mid hundreds of dollars per square foot, but actual costs depend on lot, finishes, and site-specific expenses.
- Buyers and builders should compare recent local closed sales on a per-square-foot basis, adjusting for lot size and finish to avoid over- or underestimating home value or project budgets.
Table of Contents
- What Is the Current Price Per Square Foot in Austin?
- How Has Price Per Square Foot Changed Since 2019?
- Why Does Price Per Square Foot Vary So Much by Neighborhood?
- How Does New Construction Cost Compare to Resale Price Per Square Foot?
- How Do You Use Price Per Square Foot to Value or Negotiate a Home?
- Where Do These Numbers Actually Come From?
- When Should You Trust the Number and When Should You Call a Local Expert?
- What the Data Actually Tells Us
- Get a Custom Price-Per-Square-Foot Report for Your Austin Search
- Primary Sources and Further Reading
- Sources
- FAQ
What Is the Current Price Per Square Foot in Austin?
The most current numbers tell two slightly different stories, and knowing which one you’re looking at matters more than the number itself. Realtor.com’s median listing price per square foot for the Austin metro area runs close to $333, with monthly and year-over-year percent changes published alongside it in their local market tracker. The FRED series MEDLISPRIPERSQUFEE12420, maintained by the St. Louis Fed, tracks the same underlying metric on a monthly, non-seasonally-adjusted basis and offers a longer view back through prior years.
Listing price and sold price are not the same thing, and conflating them is one of the most common mistakes buyers make when they pull a number off a website and treat it as gospel.
- Listing PPSF reflects what sellers are asking, which runs ahead of the market during price cuts or bidding wars.
- Sold PPSF reflects what actually closed, which is the number appraisers and lenders care about.
- Pending PPSF is a forward signal. TeamPrice’s 2026 breakdown notes that pending sales often run ahead of closed sales in Central Texas cities, giving an early read on whether the market is firming or softening before the closed data catches up.
The number that matters most: if you’re a buyer building an offer strategy, anchor to median sold PPSF from closed comps in the last 90 days, not the citywide listing average. That single substitution avoids more overpaying mistakes than any other adjustment in the process.
How Has Price Per Square Foot Changed Since 2019?
Austin’s PPSF story has three distinct chapters: a slow climb through 2019 and 2020, an explosive run to a 2022 peak, and a multi-year cooling and stabilization phase that’s still working itself out heading into 2026.
The 2022 peak reflected the tail end of pandemic-driven migration into Austin, when remote workers and out-of-state buyers competed hard for limited inventory. Prices pulled back meaningfully from that high, then leveled off. The FRED series shows this pattern clearly across its monthly observations, though the Fed’s own methodology notes flag that data collected before and after the 2021–2022 update isn’t perfectly comparable.
Here’s why median matters more than average when you’re reading this trend: a handful of ultra-luxury closings in West Austin or on Lake Travis can drag the average PPSF upward in any given month without reflecting what a typical buyer actually pays. Median filters that noise out, which is why Realtor.com, FRED, and most serious market trackers lead with median figures rather than average ones.
| Period | Approximate signal | Context |
|---|---|---|
| 2019–2020 | Steady, moderate growth | Pre-pandemic baseline demand |
| 2022 | Cyclical peak | Migration-driven demand surge |
| 2023–2025 | Pullback and stabilization | Rate-driven cooling, inventory rebuild |
| 2026 | Near $333/sq ft (listing) | Current Realtor snapshot |
A few things to keep in mind when you’re eyeballing any multi-year chart:
- The 2022 peak is a useful anchor point, but it’s not a target. Building a budget around “getting back to peak pricing” is a bad bet in either direction.
- Percent-from-peak calculations only mean something if you’re comparing the same methodology on both ends.
- Short monthly blips matter less than the six-month trend line.
Why Does Price Per Square Foot Vary So Much by Neighborhood?
A citywide median tells you almost nothing about what you’ll pay in a specific zip code, and this is where most first-time Austin buyers get tripped up. Central neighborhoods close to downtown routinely command a steep premium over PPSF in outlying suburbs, and lakefront or hill country properties sit in an entirely different tier from either one.
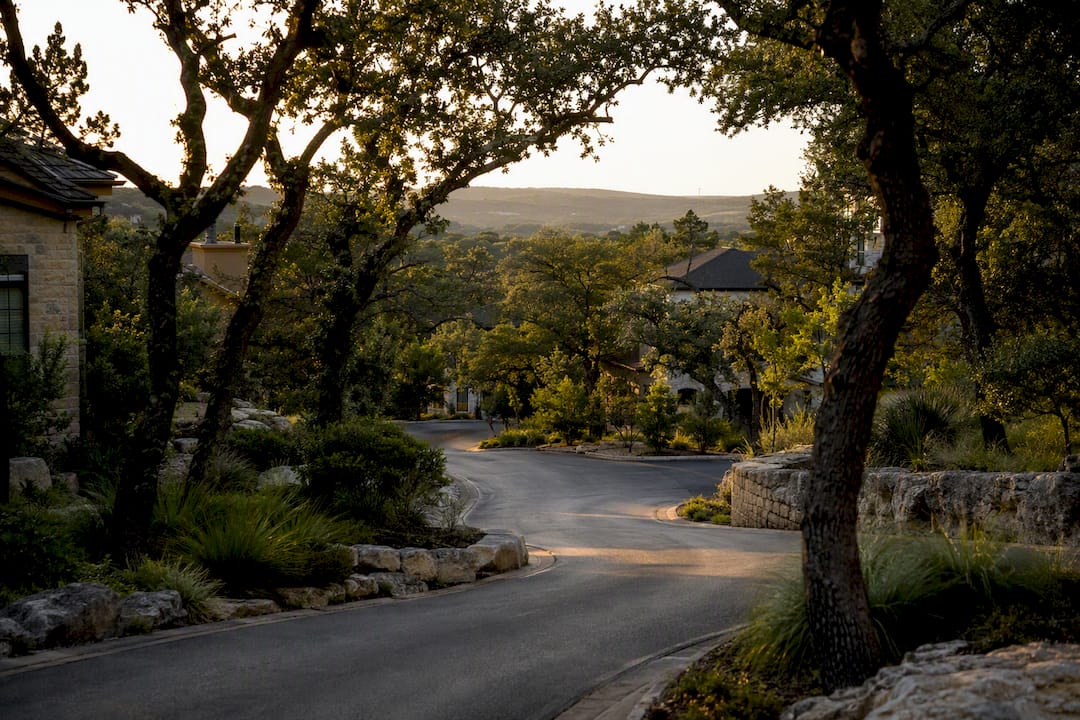
TeamPrice’s city-by-city breakdown found that the City of Austin’s median sold PPSF materially exceeds many nearby cities, with places like Jarrell coming in well below Austin proper on the same dataset. That kind of spread between Austin and a commuter suburb thirty minutes up I35 is bigger than most buyers expect until they see it laid out side by side.
A neighborhood benchmark should override the citywide median any time you’re negotiating a specific property, not the other way around. Three practical ways to pull a real zip-level number:
- Ask a local agent for closed comps within a half-mile radius and the last 90 to 180 days.
- Pull county appraisal district records for recent sales in the exact subdivision.
- Cross-check against a neighborhood-specific guide, since areas like Lake Austin carry pricing dynamics that a citywide figure simply can’t capture.
Small zip-code markets also need a bigger sample before you trust the number. A handful of closings can swing a neighborhood median by a wide margin, so widen the date window or the geographic radius until you’ve got at least a couple dozen comparable sales.
How Does New Construction Cost Compare to Resale Price Per Square Foot?
Builders and buyers evaluating new construction need a completely different number than resale PPSF, and mixing the two up leads to bad budgets on both sides of the table.
CyanBuild’s 2026 planning ranges put Austin residential new-build costs generally range from the low to mid hundreds of dollars per square foot, with custom and high-end projects running higher still. Local labor costs, permitting timelines, and soil conditions all push Austin’s construction costs above the national midpoint, according to CyanBuild’s regional breakdown.
Here’s the part that trips people up: a new build’s delivered cost per conditioned square foot doesn’t automatically match local resale PPSF, in either direction. A builder working with an expensive lot and premium finishes can easily land above nearby resale comps. A production builder on a large tract with standardized floor plans can sometimes land below them, especially in fast-growing suburban zones where resale inventory is thin.
- Construction cost ranges are planning guides, not fixed bids. CyanBuild itself recommends confirming with a local contractor takeoff before locking a budget.
- Land cost, site work, and permitting fees sit outside most quoted per-square-foot construction ranges and need to be added separately.
- Finish level swings the final number more than almost any other variable in the build.
Pro Tip: When you get a contractor’s takeoff, normalize it to conditioned living area only, add site work and permits as separate per-project line items, then compare that adjusted number against local closed-sales PPSF after backing out lot value. That’s the only way to get an apples-to-apples read on whether you’re building at, above, or below market.
How Do You Use Price Per Square Foot to Value or Negotiate a Home?
PPSF is a tool for narrowing a range, not a substitute for a real appraisal. Used correctly, it catches overpriced listings and underpriced opportunities before you waste time touring either one.
- Pull local closed-sales comps from the same subdivision or a half-mile radius, then adjust for lot size, age, and finish quality. A 1985 build and a 2023 gut renovation on the same street should never be judged on the same raw PPSF.
- Lean on median, not average, for typical valuations. Use average only when you specifically want to gauge how much luxury sales are pulling the top of the market upward. Resideline’s 2026 tracking shows a wide spread between the median closed price and the middle-half range across tracked closings, a reminder that one number rarely represents the whole distribution.
- Treat pending sales as a short-term signal, not a final answer. If pending PPSF is running noticeably above closed PPSF, that’s an early sign of firming demand worth factoring into your offer.
Quick math check: if a comp sold at $310/sq ft on a 2,200-square-foot home and your target listing is asking $340/sq ft on a similar 2,150-square-foot home with comparable finishes, you’re looking at roughly a 10% premium that needs a specific justification, whether that’s a bigger lot, a renovated kitchen, or a better school zone.
Three red flags that make a PPSF comparison unreliable: comparing across wildly different lot sizes, comparing a renovated home to an untouched one without adjustment, and relying on a sample smaller than a handful of closings in a thin submarket.
Where Do These Numbers Actually Come From?
Realtor.com calculates its PPSF metrics from active listing data and reports both listing-based and month-over-month percent changes; their research data library documents methodology updates made around 2021 and 2022 to listing-status mapping and square-footage handling. FRED’s MEDLISPRIPERSQUFEE12420 series sources from the same underlying data but publishes it as a clean monthly time series, useful for trend work but not seasonally adjusted.
Before trusting any PPSF figure, check three things:
- Whether it’s listing, pending, or sold data, since each answers a different question.
- Whether the time window spans the 2021–2022 methodology change, which can distort direct comparisons.
- Whether square footage was self-reported or measured, since duplicate or inconsistent listings can quietly skew a small sample.
When Should You Trust the Number and When Should You Call a Local Expert?
Citywide PPSF is a solid first filter. It’s a poor final answer for anything with a lot premium, waterfront frontage, or a major renovation baked into the price, because none of those show up in a simple per-square-foot calculation.
A house on Lake Austin with 40 feet of waterfront and a boat dock isn’t competing on the same PPSF scale as a similar-square-footage home three streets back from the water. The land itself is doing most of the pricing work, and no citywide average captures that.
Off-market inventory adds another layer most PPSF trackers can’t see at all, since those sales never hit public listing data in the first place.
Pro Tip: If a property sits more than 15% away from its neighborhood’s median PPSF in either direction, treat that as a flag to dig into lot characteristics, renovation history, or off-market comps before you draw any conclusion from the number alone.
What the Data Actually Tells Us
Most PPSF coverage treats the citywide median like a finished answer, and that’s the biggest miss in how this number gets reported. It’s a starting filter, nothing more. The real signal lives in the gap between the city figure and the neighborhood figure, and in the gap between resale PPSF and what it actually costs to build.
The conventional advice to “check the median” isn’t wrong, but it stops one step too early. A buyer who compares a listing to the citywide average and calls it a day will misjudge plenty of good deals and plenty of bad ones. A builder who prices a project off a national construction cost table instead of Austin-specific ranges will miss their budget by a wide margin.
If you take one thing from this data: prioritize local, recent, adjusted comps over any single published average, whether that average comes from a national site or a metro-wide series. The number is only as useful as the comparison behind it.
— Mike
Get a Custom Price-Per-Square-Foot Report for Your Austin Search
A national average or a citywide chart won’t tell you what your target street, lot, or floor plan is actually worth right now. A local real estate group builds that answer from local closed comps, off-market activity, and neighborhood-specific data that never shows up in a public listing feed.
Where this matters most is access. A meaningful share of Austin’s highest-value inventory never appears in a public search, which means any PPSF you calculate from listing sites alone is working from an incomplete picture. Mogavero Group’s private listings give buyers a look at off-market opportunities alongside a benchmark built from actual local transactions, not a metro-wide blend. If you’re weighing a purchase, a build, or a sale and want a PPSF figure specific to your neighborhood rather than the whole city, request a custom local valuation and a local expert can pull the comps that actually apply to your situation.
Primary Sources and Further Reading
- Median Listing Price per Square Feet, Austin-Round Rock (MEDLISPRIPERSQUFEE12420) — FRED
- How to Price Austin Property for Maximum Seller Value
Sources
- Housing Inventory: Median Listing Price per Square Feet in Austin-Round Rock, TX (CBSA) (MEDLISPRIPERSQUFEE12420) | FRED | St. Louis Fed
- Construction Cost Per Square Foot Austin 2026 | CyanBuild
FAQ
What’s a Reasonable Price Per Square Foot in Austin?
A reasonable figure tracks close to the current citywide median of roughly $333 per square foot on listings, but the right number for any specific home depends heavily on neighborhood, lot, and finish level, so always check local closed comps first.
Is $200 Per Square Foot Good in Austin?
A price per square foot significantly below Austin’s current citywide median often indicates a strong value if you find it in a desirable area, though it’s worth checking whether that price reflects an older home, a smaller lot, or a location further from the urban core.
Are Home Prices Still Dropping in Austin?
Austin’s market has cooled and stabilized since its 2022 peak rather than continuing a sharp decline, with pricing now moving more on a neighborhood-by-neighborhood basis than a uniform citywide direction.
Is $70,000 a Good Salary in Austin?
That’s an income question rather than a housing-cost one, but it directly affects home affordability: at Austin’s current PPSF levels, a modest salary typically supports a smaller or more distant property unless paired with a larger down payment or a co-buyer.
Should I Use Median or Average Price Per Square Foot?
Use median for typical home valuations, since it isn’t skewed by a handful of luxury closings the way an average can be; reserve average PPSF for gauging how much high-end sales are pulling the top of the market.